Introduction
Under 7 U.S.C. § 2013(a)(2), as amended by the One Big Beautiful Bill Act (Pub. L. No. 119-21, 2025; OBBBA), a state whose SNAP payment error rate reaches 6% will pay 5% of benefit costs beginning in fiscal year 2028; at 8%, the share is 10%; at 10%, it is 15%. The rate that determines the FY2028 share is the state’s fiscal 2025 or 2026 rate, at its election; later years use the third preceding year. Implementation is delayed for the highest-error states: a state whose fiscal 2025 rate times 1.5 reaches 20% — that is, a rate above 13.33% (13.34% at the published two-decimal precision) — starts in FY2029 instead, and a state whose fiscal 2026 rate crosses the same test starts in FY2030.1 For a mid-sized state, one tier is worth tens of millions of dollars a year; for the largest states, more than a hundred million.
The error rate is estimated by the Quality Control system: each state re-reviews a probability sample of its own active cases — by formula in 7 C.F.R. § 275.11, between 300 and 2,400 annually, or 300 to 1,020 under an optional reduced schedule that every state elected in fiscal 2024 (U.S. Department of Agriculture, Food and Nutrition Service 2025b) — and federal reviewers re-review a subsample, from which the Food and Nutrition Service (FNS; renamed the Food and Nutrition Administration in 2026 — the fiscal 2025 rate publication carries the new letterhead (U.S. Department of Agriculture, Food and Nutrition Administration 2026), and this paper keeps FNS, the name on every document the fiscal 2024 data cite) estimates official state rates with adjustments including federal re-review integration. The public-use files that result record, for roughly 45,000 cases a year, what the agency issued and what the review concluded the case should have received, with coded findings for every discrepancy.
This paper treats those files as a research instrument with three uses, the first in the software-testing sense of an oracle: an external source of ground-truth outputs for given inputs.
First, as a verification target for rules as code. I test independently encoded SNAP rules — statute, regulations, and state policy manuals encoded as executable rule modules — against the QC file’s recorded benefit computations in seven states, holding the bar at exact reproduction: zero dollar tolerance across six computation stages per case (Section 4). The target’s precise character matters and is stated in Section 4.1: the file’s benefit chain is the FNS QC Minimodel’s computation on edited, internally consistent case records, so parity certifies agreement with the agency’s own computational canon, not independent adjudication. Reaching it surfaced defects on three sides: two in the encodings under test, errata in the federal technical documentation, and a residue attributable to state issuance systems.
Second, as raw material for decomposing measured error. QC’s own cause coding, a finding-nature classification, and a replay of reconstructed pre-edit case facts through the verified engine give three nested estimates of how much of the error rate reflects computation failure versus wrong facts correctly processed (Section 5).
Third, as training and validation data for a case-level model of the error process (Section 6) and the basis for a distributional simulator of measured rates under the cost-sharing formula (Section 7), public at policyengine.org/us/snap-payment-error-simulator. The simulator’s central output is a measurement result: near tier boundaries, sampling noise alone gives several states nearly even odds of a different cost tier than their point rate implies.
The analysis pipeline, simulator, and this manuscript live in one public repository; a fact catalog maps every quantitative claim to a committed artifact (Section 11). The pipeline is deterministic — independent clean-room reruns reproduce every analysis artifact byte-for-byte, and the headline simulation artifact was independently reproduced from the raw file to four decimals — and the manuscript has been through six rounds of adversarial review, archived unedited in the repository.
The QC system and the money attached to it
QC reviews produce, for each sampled active case, the issued allotment and a corrected allotment constructed from the reviewer’s findings; when they differ by more than a tolerance threshold ($56 in fiscal 2024, indexed from a $37 statutory base under 7 U.S.C. § 2025(c)),2 the case is a payment error, and findings are coded for sub-threshold deviations as well. Table 1 lists the public-use file variables this paper works with; variable names in the text refer to these columns. The official state rate combines over- and underpayment rates (U.S. Department of Agriculture, Food and Nutrition Service 2025a): Colorado’s 9.97% is 7.91 over plus 2.06 under, and Maryland’s 13.64 includes the nation’s highest underpayment rate, 4.79 — so cost sharing partly bills states for underpaying their own residents.
| Variable | What the file records |
|---|---|
RAWBEN |
the allotment the state actually issued |
BENFIX |
the allotment corrected for the reviewer’s findings |
AMTERR |
the recorded error amount |
FSBEN |
the formula benefit recomputed by the FNS QC Minimodel from the case’s edited inputs |
STATUS |
the review disposition (correct, overpayment, underpayment) |
ELEMENT1-9, E_FINDG1-9, AMOUNT1-9 |
up to nine coded error findings: the element in error, the nature of the finding, and its dollar amount |
HWGT |
the case weight |
FSGRINC, FSSTDDED, FSNETINC and companions |
the recorded benefit-computation chain: gross income, deductions, net income, maximum allotment |
Four features of the system frame everything that follows.
The public file is not the full review universe. The edited public-use file excludes cases with ineligible findings — for which the official methodology scores the entire issued benefit as error dollars — cases whose overissuance equals or exceeds the issued benefit, incomplete reviews, and internal-consistency drops (U.S. Department of Agriculture, Food and Nutrition Service 2025b). In fiscal 2024 this removed 1,037 ineligible-finding and 406 full-overissuance cases nationally. The file is therefore truncated at the top of the error-magnitude distribution. Every file-based estimate in this paper inherits that truncation: it is part of why Colorado’s file-derived rate (8.88%) sits below its official 9.97%. Restoring the excluded cases would add a large between-component variance term — their per-case error contributions are the full issued benefit — so the truncation biases simulated sampling variability downward; the i.i.d. approximation to states’ month-stratified sampling designs plausibly biases it upward, so the tier-noise results of Section 7 are likely, though not certainly, understated.
The measured rate is a property of the measurement system. Between roughly 2009 and 2016, several states used consultant-driven error-review practices that biased QC findings downward; the Department of Justice recovered more than $67 million in False Claims Act settlements from eight states over 2017–2021 (U.S. Department of Justice 2021), FNS issued formal anti-bias guidance, and national rates for fiscal 2015–16 were not published (Congressional Research Service 2018). This history is why the present analysis trains no earlier than fiscal 2017 — and why the fiscal 2025–27 rates now being measured, which carry orders of magnitude more money than the settlements-era rates did, cannot be treated as exogenous to the incentive they price.
Only active cases are priced. The QC system also reviews negative actions — denials, terminations, suspensions — feeding a separate case-and-procedure error rate that OBBBA does not price. A state can therefore lower its priced error rate by tightening the front door, shifting error into the unpriced metric. This paper analyzes the priced, active-case system; the asymmetry belongs on any list of the formula’s incentive properties.
Precision was contractually waived. A state electing the reduced sampling schedule agrees not to dispute later error-rate findings on the basis of the precision of the estimates (U.S. Department of Agriculture, Food and Nutrition Service 2025b). All 53 jurisdictions had so elected as of fiscal 2024 — a defensible economy when QC reviews were an administrative cost with no tier attached, and a striking one now that precision determines tier placement worth tens of millions of dollars. The cost calculus has since moved against precision even as its value rose: OBBBA cut the federal share of SNAP administrative costs — QC review staffing included — from 50% to 25% beginning fiscal 2027 (Pub. L. No. 119-21 § 10106), so each additional review now costs a state three dollars where it used to cost two. Whether states revert to the standard schedule — regaining precision and dispute rights at that higher marginal price — is a live sampling-plan question, and exactly the one Section 7 prices with its additional-reviews lever.
The QC file as a verification oracle
Rules as code — encoding statutes and regulations as executable, testable logic — has a recognized validation problem: against what do you test the encoding? Unit tests encode the encoder’s own reading of the law, and cross-model comparisons inherit both models’ assumptions; the literature has approached validation by compiling legal text alongside experts (Mérigoux, Chataing, et al. 2021; Mohun and Roberts 2020) and, closest to this paper, by testing an independent encoding of the French tax code against the tax authority’s own published test cases (Mérigoux, Monat, et al. 2021). Administrative QC data extends that strategy to a benefits program at case level: tens of thousands of real cases per year, each carrying inputs and the agency’s own computed outputs.
I tested encodings of federal SNAP law and seven states’ policy manuals (Arizona, California, Colorado, Georgia, Maryland, New York, Texas), maintained by The Axiom Foundation in its public rulespec-us repository and executed by its deterministic rules engine, against the fiscal 2024 QC file. The file contains 6,194 cases in the official universe for those states; 6,081 are in scope for replay — all 113 exclusions (1.8%) are SSI-CAP (Combined Application Project) standardized-benefit units, whose allotments follow a demonstration schedule outside the computed chain, logged per case by the harness. Table 2 reports the counts. For each in-scope case the harness asserts six values — gross income, standard deduction, excess shelter deduction, net income, maximum allotment, and benefit — against the file’s recorded values at zero dollar tolerance. These six are the stage outputs the public file records for the computed chain; adjudication-dependent amounts the reviewer establishes as facts — claimed medical expenses, utility allowances, child-support obligations, eligibility findings — enter as inputs rather than assertions. The assertion surface can widen as encodings and file coverage allow (the earned-income deduction, for instance, is mechanical given earnings), and the excluded SSI-CAP units are themselves encodable: their demonstration benefit schedules are published in the technical documentation, so bringing them in scope — for both verification and simulation — is an encoding task, not a data gap.
All 6,081 in-scope cases match on all six asserted values — 36,486 exact cell comparisons, no mismatches.
| State | In-scope cases replayed exactly | Official-universe cases | Excluded |
|---|---|---|---|
| Arizona | 922 | 925 | 3 |
| California | 883 | 883 | 0 |
| Colorado | 856 | 856 | 0 |
| Georgia | 945 | 945 | 0 |
| Maryland | 722 | 745 | 23 |
| New York | 847 | 885 | 38 |
| Texas | 906 | 955 | 49 |
| Total | 6,081 | 6,194 | 113 |
What the parity target is
Exactness claims invite overreading, so the scope deserves a precise statement — more precise than an earlier draft of this paper gave it.
The compared benefit chain is the one recorded in the edited public-use file, whose benefit variable (FSBEN) is computed by the FNS QC Minimodel — the agency’s own benefit-calculation software — and whose editing process reconciles case records until internal identities hold, adjusting deduction fields in a documented sequence until the calculated benefit matches the raw benefit within $5 (U.S. Department of Agriculture, Food and Nutrition Service 2025b). The comparison also supplies several intermediates directly from the file rather than deriving them from raw facts: the QC-calculated medical and child-support deduction amounts, the recorded utility allowance, and the recorded categorical-eligibility status; eligibility screens receive passing defaults, since every filed case was enrolled.
Parity therefore certifies the following: that the encoded computation chain — income aggregation, deduction sequencing, net-income arithmetic, allotment lookup, rounding — agrees exactly with the agency’s own computational canon, over the full diversity of 6,081 real case configurations, parameter values, and boundary conditions. It is an agreement between two implementations of the same rules, closer in kind to the cross-model comparisons this method extends than to independent adjudication of case outcomes; what distinguishes it from ordinary cross-model comparison is the counterparty (the agency’s own canon), the case realism, and the zero-tolerance bar. It does not certify independent derivation of every state eligibility and deduction pathway from raw facts. Extending the harness to feed raw facts — recorded medical expenses rather than the computed deduction, energy-assistance facts rather than the utility tier — is the necessary next step before the engine can compute counterfactual intermediates under alternative policy (Section 8). The reviewer-adjudicated quantities in the file (RAWBEN, BENFIX, error amounts and findings) are not the parity target; they are the subject of Section 5.
Holding tolerance at zero is what made the exercise informative. Early runs did not match, and each mismatch class was a finding about somebody’s rules: two defects in the encodings under test (a regulatory dollar literal superseded by statute, and a missing whole-dollar rounding step — both fixed in the public repository, with the oracle as the detector), errata in the technical documentation’s variable descriptions (reported upstream), and — once the encodings reproduced the file’s chain exactly — a residue in issued amounts attributable to the issuing side, which Section 5 takes up. The corrections were global rule fixes, not case-specific accommodations; still, the exactness result is post-correction on the same case set, a reuse the certification protocol mitigates but does not eliminate. A confirmatory run on the fiscal 2025 file at its release is the committed next test.
The toolchain is certified for reproduction: a pinned engine build and encoding-repository commit reproduce the Colorado suite — 856 cases, 5,136 cells including the 856 benefit cells — under recorded hashes for every input, with an independent audit rebuilding the engine to a byte-identical binary and re-running the comparison to byte-identical evidence. Throughput is 230 cases per second end to end on a laptop, so verification at this scale is not compute-bound for this workload; details and timing calibration are in the repository’s certification report.
Decomposing measured error: computation versus facts
If a verified engine issued every benefit, how much measured error would disappear? The QC file supports three nested answers for Colorado fiscal 2024, summarized in Table 3: 305 of 856 sampled cases carry recorded payment deviations (RAWBEN ≠ BENFIX) — but only 110 of the 305 are official errors above the $56 threshold; the other 195 are sub-threshold deviations the official rate excludes. Weighted, the 305 carry $112.6M per year in deviation dollars on $1.268B of issuance, of which $18.5M (16%) is sub-threshold: the deviation-based 8.88% file rate therefore combines an official-definition file rate of 7.42% with sub-threshold dollars, while the official 9.97% additionally incorporates the federal re-review adjustment and the excluded ineligible-case error of Section 3. All three layers exclude, by construction of the file, that ineligible-case error.
analysis/cause_shares.json, all 53 jurisdictions, conventions and code-to-class maps serialized in the file); layer 3 is a share of filtered cases. Any-presence attribution counts a case’s dollars toward every cause class present in its slots, so layer-1 classes overlap. Layer 2 partitions cases; its system-side test reuses layer 1’s broad computing-apparatus cause set — the artifact also carries a wider agency-responsibility convention under which the system-side shares are several times larger (Colorado system-caused input 31% rather than 6.6%), answering a responsibility question rather than this table’s computation question. Cause and nature coding reflect state reviewer judgment under handbook guidance (U.S. Department of Agriculture, Food and Nutrition Service 2023) and carry cross-state coding variation; fiscal 2024 also brought minor revisions to the finding-code sets.
| Layer | Definition | Computation-side share | Universe and units |
|---|---|---|---|
| 1. Cause codes | QC agency-cause codes naming the computing apparatus (programming, arithmetic, mass change), any-presence across a case’s nine cause slots, share of official error dollars (HWGT × AMTERR) |
7.4% strict ($6.9M/yr); 10.6% ($10.0M/yr) adding policy-misapplied, budgeted-wrong, computer-user | Colorado; nationally 3.5% strict ($232M/yr), 19.3% broad ($1.27B of $6.59B) |
| 2. Finding natures | NATURE codes inherently describing computation (rounding, conversion, wrong standard, benefit miscomputed) plus the arithmetic ELEMENT; deduction-amount natures count only when the paired cause is in layer 1’s broad computing-apparatus set |
3.3% pure-computation; 6.6% system-caused input; 4.2% mixed; 86.0% other input | Colorado weighted deviation dollars; nationally 4.6% / 11.1% / 6.5% / 77.7% |
| 3. Engine replay | Reconstructed pre-edit facts replayed through the verified engine and compared to issued amounts | Above-threshold official errors: 21.6% of cases unexplained (upper bound), 78.4% explained as correct arithmetic on wrong facts. Sub-threshold deviations: 8.6% unexplained, 91.4% explained. Blended: 13.1% / 86.9% | 283 filtered Colorado deviation cases (97 above threshold, 186 below); case shares, not dollar shares |
The strictest layer reconstructs each error case’s pre-edit original values using the public reconstruction solver of Giannella and Molin (2026) — which exploits the file’s disclosure-protection perturbation structure to recover original values — adapted to fiscal 2024, then replays those originals through the verified engine. Of 283 deviation cases surviving the solver’s consistency filters (22 of 305 are excluded), 246 reproduce the issued amount at the file’s own $5 editing tolerance: the agency’s arithmetic was correct, applied to wrong facts. The rate differs by threshold status, and the distinction matters for how the headline reads: among the 97 above-threshold official error cases, 76 are explained (78.4%, binomial standard error about 4 points; the 21.6% residual is the computation-side upper bound for official errors), while among the 186 sub-threshold deviations 170 are explained (91.4%). The solver and the engine partition the 283 cases identically — two implementations with distinct codebases and logic reaching the same classification, though both consume the same file, and 33 of the 246 explained cases have deviations of $5 or less, mechanically within the comparison tolerance. The residual class includes solver limitations as well as genuine multi-variable or computational discrepancies. The complete per-case replay output (283 rows), the layer-1 and layer-2 classification outputs, and the reconstruction scripts are committed with this paper.
The three layers agree on the structure: most measured SNAP payment error among eligible cases is information failure, not calculation failure — consistent with the administrative-burden literature’s account of where compliance costs bind (Herd and Moynihan 2018). Correct-computation guarantees address the smaller share directly — roughly 3 to 10% of error dollars by layers 1–2, and bounded above by the replay’s 21.6% case share among official errors — plus whatever share of information failures better tooling prevents indirectly through verification prompts and documentation-requirement computation at intake; Section 7.2 prices the direct shares through the formula’s tiers, elections, and delay clause. Ineligibility errors, excluded from the file, are predominantly facts-driven, which would push the information-failure share higher still; that inference, unlike the in-file shares, is not directly computed here. The indirect channel is where policy design enters: rules determine what a caseworker must collect and verify, which is the mechanism the modeling section takes up.
Modeling the error process
Pricing decisions — what a documentation requirement costs in error, what an audit-volume change buys — require a model of the error-generating process at case level. I fit one on the QC files for 2017–2019 and 2022–2023 (pandemic years excluded), evaluating on fiscal 2024: 217,656 training and 44,800 evaluation cases in the official universe, all estimates weighted by the file’s case weights, with models estimated in scikit-learn (Pedregosa et al. 2011). Fiscal 2024 informed pipeline development across the audit-and-correction rounds and is not a pristine holdout. The committed next test is a frozen-pipeline confirmation on the fiscal 2025 file, and its harness is built and waiting: the four scoring modules are hash-frozen, the runner refuses drifted code, and replaying fiscal 2024 through it reproduces the committed reference values exactly — publication day is one command against frozen code; the one-shot, no-re-tuning discipline is a stated commitment the harness supports rather than enforces, and anything after the first run is labeled post hoc.
The modeled object is the per-case distribution of what the state issued relative to what the review concluded it should have: the signed deviation \(D = \texttt{RAWBEN} - \texttt{BENFIX}\), whose distribution — given the corrected benefit — is the distribution of issuance itself. \(D\) reconciles with the file’s recorded error amount for 99.997% of weighted fiscal 2024 cases. The recomputed formula benefit FSBEN is not a usable target — \(|\texttt{RAWBEN} - \texttt{FSBEN}|\) matches the recorded error amount for only 83.64%, because it conflates legitimate adjustments such as proration with error — but it serves as a model feature, anchoring each case’s formula benefit. A committed case-by-case catalog quantifies the conflation for the seven verified states (analysis/engine_comparison.json, served in the deployed simulator’s engine view): per state, BENFIX reconciles with the recorded error amount exactly while FSBEN concordance runs 0.80–0.91, with 881 of the 6,194 official-universe cases diverging — the comparison reads only file columns, so it covers the 113 replay-excluded SSI-CAP cases as well — classified by the file’s own coding into allotment adjustments, error corrections, and recorded-correct nonformula cases. The official error label (reviewer status with an amount above the year’s threshold) defines the binary outcome used for discrimination checks.
Discrimination. A gradient-boosted classifier of the official error label on household covariates plus the formula-benefit anchor reaches a weighted area under the receiver operating characteristic curve (ROC AUC) of 0.761 on fiscal 2024; adding policy-burden intermediates extracted from the file (medical-expense claiming and documentation-requirement proxies, self-employment records, utility-claim structure, deduction counts) moves it to 0.767 (+0.006 AUC, +0.003 PR-AUC). At a 5% weighted review budget the classifier reaches 47.8% precision against a 13.4% weighted base rate — case targeting at three and a half times chance, though QC-sampled cases are not the operational targeting population and the estimate carries no design-based standard error.
The deviation distribution. For simulation I estimate a per-case distribution of the signed deviation with a hurdle structure: a deviation probability \(P(|D| > 0.5)\) and an above-threshold probability, each estimated by gradient boosting with nested out-of-fold isotonic calibration; a sign model (calibrated AUC 0.700 in the shipped frozen configuration); nine conditional quantiles of \(\log|D|\) fitted by quantile-loss gradient boosting (Koenker and Bassett 1978), made monotone per case by rearrangement (Chernozhukov et al. 2010); and an exponential tail in logs beyond the 99th percentile. Conditional magnitudes retransform with an out-of-fold Duan smear of 1.173 (Duan 1983); predicted mean conditional magnitude is $186 against $189 observed. The tail is fitted at the depth where it attaches (log scale 0.252), each case’s magnitude is capped at a physical maximum, and state dollar-rate factors are fit on out-of-sample fiscal 2023 predictions and frozen.
Validation, including failures. Table 4 summarizes, for the configuration that ships: the frozen model trained through fiscal 2022 (62,984 training deviators), with fiscal 2023 held out for factor fitting and fiscal 2024 for evaluation. Coverage of the conditional quantiles fails: within 3 points of nominal at only two of nine levels, all nine gaps negative (−0.38 to −7.30 points, worst at the 75th–90th percentiles). This is one-sided under-coverage — predicted quantiles sit too low, understating mid-to-upper magnitudes, coherent with the $186-versus-$189 comparison. The under-coverage is not specific to the gradient-boosted quantile stack: under a pre-specified decision rule, a quantile regression forest on the identical protocol (benchmarked against the model without the three certification/BBCE/premium feature families) improves mean absolute coverage (4.10 against 4.38 points) but shifts under-coverage from the tail to the central levels with a worse maximum gap, degrades probability-integral-transform calibration, and loses the factor-adjusted state dollar-rate comparison (0.951 against 0.928 points — a different object from Table 4’s official-error-rate MAE), so the gradient-boosted stack is retained; causes the two estimators share — the feature set, the tree-ensemble family, the temporal gap from the frozen training window to fiscal 2024 — remain candidates.
Two pre-registered repair experiments, each with its protocol committed before its results (the two-commit ordering survives squash merges in the pull-request refs, #53 and #55), interrogate the failure. A dispersion round tested a conformal remap of nominal quantile levels and per-state spread inflation, fit on leave-one-year-out training folds; its mechanical winner improved the mean absolute gap to 4.08 points while collapsing fifth-percentile coverage from 4.6% to 0.02%, and adoption was declined in a decision recorded beside the frozen protocol. The round’s real product is a diagnostic: every mechanism leaves all nine gaps negative, so the failure behaves as location rather than width under every tested mechanism. A location round followed under per-level guards — no level may worsen more than half a point, no new over-3-point flags, a lower-tail coverage floor — and a single global shift of +0.038 log dollars wins them cleanly: the mean absolute gap falls from 4.64 to 3.80 points with every level improving (the median level from −7.11 to −5.62), while two more flexible mechanisms posted lower means and failed the per-level guards the second protocol added. The repaired calibration is committed and stays out of the scoring path until the fiscal 2025 confirmation runs against the frozen modules. The residual — every gap still negative, the deepest misses at the middle levels — reads as data limitation rather than estimator choice, and partner-state administrative records are the strongest available data against it.
The deployed simulator serves this model in exactly one place — a standard-medical-deduction scenario whose flipped per-case parameters, paired-bootstrap intervals, and level gate ship in an export pinned to the exact model file by hash, with the seven jurisdictions outside the [0.7, 1.4] factor-adjusted level-ratio range disabled — and no simulation result in this paper uses model draws.
| Quantity | Unfactored (frozen model) | With frozen FY2023 factors |
|---|---|---|
| State MAE, equal-weighted | 1.73pp | 0.875pp |
| State MAE, issuance-weighted | 1.57pp | 0.808pp |
| Cross-state correlation (equal-weighted) | 0.56 | 0.91 |
State-level calibration uses a strictly temporal protocol: models fit through 2022 predict 2023 out of sample; state observed-to-predicted ratios, shrunk toward one by an empirical-Bayes precision rule \(\tilde{f}_s = 1 + (f_s - 1)\,\tau^2/(\tau^2 + v_s)\), with \(v_s\) the delta-method ratio variance on Kish effective sample size, are frozen and applied to fiscal 2024. Most cross-state alignment comes from the factors, whose interpretation — administration, omitted policy, model error — the data do not identify.
Policy contrasts are descriptive. Under an event definition requiring a medical finding with payment impact, elderly/disabled claimants in states without a standard medical deduction — where itemized documentation is required — show a 2.60% medical-event rate, against 2.97% in a mixed comparison cell (standard-deduction-state claimants pooled with below-floor claimants everywhere); the cross section runs against a simple burden-increases-error reading, and adoption is endogenous. Calendar-aligned adoption contrasts against never-adopting states are small and mixed — Arizona +2.07 points claimant-conditioned but +0.64 on the stable all-elderly/disabled denominator; Kentucky −0.42 claimant-conditioned; California +0.11 claimant-conditioned but −1.40 on the stable denominator; Louisiana and Michigan within 0.2 points of zero, though those two adopters have zero treated-period events in the windows, so their contrasts are control-trend arithmetic only — with single-digit event counts throughout. Two cautions transfer beyond this paper: an earlier pipeline’s dramatic Kentucky estimate (−5.3 points) dissolved under a corrected event definition and calendar windows; and standard-medical-deduction adoption is typically bundled with utility-allowance offsets for cost neutrality, so these are contrasts of policy bundles. Causal identification awaits engine-computed counterfactuals (Section 8).
Three further feature families enter every model stage as seventeen case-level features: certification timing (months since certification and period length from the file’s LASTCERT and CERTMTH, a final-two-months indicator, and its interaction with elderly/disabled composition), state broad-based categorical eligibility from the FNS State Options Reports (44 adopting agencies in fiscal 2024, mapped to each training year’s report edition; the file’s own CAT_ELIG is excluded because its codes conflate BBCE with traditional categorical eligibility), and Medicare Part B premium bands — reconstructing gross medical expense as the file’s excess amount plus the $35 deduction floor and comparing it with the sampled month’s published premium. Their marginal contribution, holding the protocol fixed: classifier ROC AUC 0.7666 to 0.7679, hurdle stage-1 AUC 0.8356 to 0.8397, equal-state calibration MAE 1.83 to 1.71 percentage points, distributional coverage’s mean absolute gap 4.38 to 4.64 points (worse). The band construction validates exactly where it should: all 36 elderly Colorado cases censored at the state’s $165 standard medical deduction map, after the floor reconstruction, to $200 gross — inside the just-above-premium band — where a naive comparison on the excess scale misclassifies six of them.
Simulating measured rates under cost sharing
The public simulator resamples each state’s own sampled cases with replacement at the realized or a hypothetical sample size and recomputes the weighted error rate (Efron 1979), centered on the official rate. The error definition is the official one — adjudicated status with the recorded amount above the threshold. Three findings, all on fiscal 2024 data, all inheriting the file’s truncation of ineligible-case error (which understates the variability shown) and an i.i.d. approximation to each state’s actual sampling design; the official rate’s federal re-review adjustment enters only as a fixed level. That fixed layer deserves a number: the gap between each state’s official fiscal 2024 rate and the rate computable from its public file — federal re-review integration plus the ineligible-case error the file never records — is a median 31% of the official rate across jurisdictions, ranging from −3% (the adjustment can run downward: Minnesota and Nevada) to 44% for New York and 81% for Alaska. Anchoring keeps the level right, but the layer contributes no sampling variance to the draws and no scenario in this paper reaches it; the deployed simulator now discloses each state’s own file-covered share alongside its results. A committed registry decomposes the wedge by the published components: nationally, the official 10.93% fiscal 2024 rate is a 7.22% file-computable rate (5.73 overpayment plus 1.49 underpayment) plus a 3.71-point wedge, and 3.53 of those points — 95% — sit in the overpayment component, with twenty states’ underpayment wedges running negative. That concentration is consistent with the excluded ineligible-case error, which is overpayment by construction, dominating the layer — though the publications do not separately identify it from the federal re-review integration, so the split stays an accounting decomposition rather than an attribution. All figures quote the committed simulation artifact.
Tier assignment approaches a coin flip for boundary states (Figure 1, Table 5). With no policy change at all, the probability that a fresh QC-style sample lands in a different cost-share tier than the official point rate implies is 46–50% for the five states nearest boundaries.
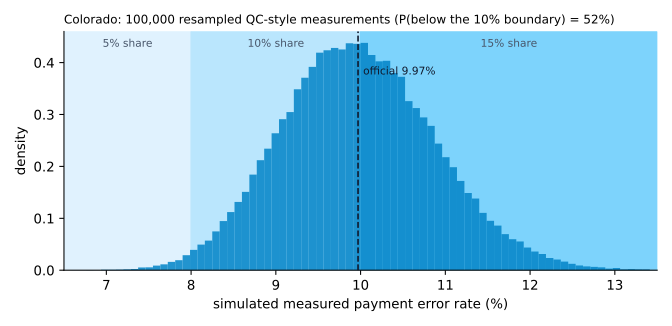
paper/generate_figures.py (seed 11).
The formula maps a point estimate to a tier with no adjustment for sampling uncertainty; near a boundary, tier assignment turns as much on the sampling draw as on the underlying rate. This is the accountability-measurement problem documented for school accountability ratings (Kane and Staiger 2002), now carrying direct fiscal prices.
| State | Official rate | P(different tier) | Expected annual cost share | SD of the bill |
|---|---|---|---|---|
| North Dakota | 7.91% | 50% | $7.9M | $3.5M |
| Washington | 6.06% | 48% | $50.2M | $48.5M |
| Colorado | 9.97% | 49% | $156.4M | $32.8M |
| Kansas | 9.98% | 47% | $46.9M | $9.5M |
| Nevada | 5.94% | 46% | $23.7M | $26.0M |
Audit volume is a two-sided instrument. Increasing the QC sample shrinks sampling variance around the state’s underlying rate, holding the error process fixed (Section 9; the corrective-feedback channel from reviewing more cases is not modeled, and these figures are gross of review costs — which rose for states when OBBBA cut the federal administrative match from 50 to 25% beginning fiscal 2027). In expectation, 500 additional reviews save money for states just below a boundary — Missouri +$3.9M, Tennessee +$3.7M, Indiana +$3.3M annually — and cost money for states just above one, for whom the chance of a below-boundary draw had positive expected value: California −$30.3M, Pennsylvania −$13.1M, Texas −$13.1M. Added volume almost always reduces the standard deviation of the annual bill (California by $44M), so risk-averse states may rationally buy audits against their expectation. The formula thus embeds an asymmetry: expected cost share falls with additional sample volume for states just below a boundary and rises for states just above one — a property worth reading alongside the no-dispute election of Section 3.
Category-suppression bounds are large. Removing 50% (100%) of the observed error dollars attached to the finding elements that four policy options standardize — the standard medical deduction, standard self-employment deduction, heat-and-eat utility standardization, and broad-based categorical eligibility resource exemptions — corresponds to roughly $609M ($1,310M) per year nationally in expected cost share. These are accounting bounds, not causal estimates: they hold the error process fixed and answer “what if these categories’ observed error dollars shrank,” an upper-bound identity rather than a behavioral prediction — the descriptive adoption contrasts of Section 6 are the reason for the caution. They speak only to measured error and cost share; the options themselves change benefit amounts, eligibility, and program cost, none of which is modeled here. Two further scope notes: OBBBA itself narrowed the heat-and-eat channel, restricting the LIHEAP-triggered utility allowance to households with an elderly or disabled member (§ 10103), so that lever’s fiscal 2024 error mix overstates its remaining reach; and the expected cost-share effect of a marginal error reduction is near zero for states deep within a tier (New York at 14.09%, Alaska at 24.66%) and largest near boundaries.
The realized fiscal 2025 rates
The simulation’s claim — that tier assignment at current sample sizes is substantially a draw from sampling noise — is built from fiscal 2024 microdata alone. On June 24, 2026, the renamed agency published the fiscal 2025 rates (U.S. Department of Agriculture, Food and Nutrition Administration 2026); this repository postdates that publication, so what follows is a check of input independence, not a registered forecast — the fiscal 2025 rates enter the analysis only as the realized outcomes being classified, and the noise scale that classifies them uses no fiscal 2025 information. Eighteen of 53 jurisdictions changed cost-sharing tiers. Whether any single change reflects program performance is exactly the question sampling error poses: under the committed simulator’s FY2024 sampling standard deviations, with both years carrying independent noise of equal scale, a year-over-year move is distinguishable from noise at 95% confidence only beyond 2.77 of a single year’s standard deviations. Ten jurisdictions cleared that bar (Delaware, Florida, Hawaii, Illinois, Kentucky, Minnesota, North Carolina, New Jersey, Ohio, and West Virginia) — but only seven of those ten changed tiers, so 11 of the 18 tier changes sit inside the noise band; the median jurisdiction moved 1.38 standard deviations. Movement figures come from the committed movement artifact (deterministic, seed 11; Section 11); tier-step and election dollars come from the deployed simulator’s committed inputs and its election engine, and price shares at fiscal 2024 issuance levels — no caseload or allotment growth to the billed year is projected.
The two tails of that distribution make the point more sharply than the counts. Colorado moved from 9.97% to 10.09% — 0.12 percentage points, 0.13 standard deviations, indistinguishable from re-measuring the same program — and that move crossed the 10% boundary into the 15% tier, repricing its FY2028 exposure by roughly $63M a year at fiscal 2024 issuance levels. Real movement exists alongside it: Hawaii went from 6.68% to 10.92% (11.2 standard deviations, two tiers up), New Jersey from 14.33% to 6.86% (−11.2, from the top tier to the 5% tier), Kentucky from 9.11% to 4.70% (−7.2, into the 0% tier). The formula cannot tell these apart; it prices Colorado’s noise and New Jersey’s real movement — whatever mix of program change and review practice produced it — with the same schedule. The national rate fell from 10.93% to 10.62%.
The realized year also calibrates how much true year-over-year process movement the sampling-only simulator omits. Across states, the variance of the one-year change decomposes as twice the mean squared sampling standard deviation plus a process-drift variance \(\tau^2\); the method-of-moments estimate is \(\tau = 1.62\) percentage points (95% CI 0.81–2.25 from a paired bootstrap over jurisdiction movement–SD rows), and a median/MAD version robust to the large realized moves gives \(\tau = 1.07\) (CI 0–1.74). Process drift on this transition is likely real — the classical interval excludes zero; the robust one does not — and comparable in scale to sampling noise for a typical state, though a single transition cannot separate program drift from any change in QC design or practice between the two years. The simulator’s draws remain sampling-only — a disclosed lower bound on total year-over-year uncertainty — with the drift estimate carried as a candidate calibration rather than silently added.
Churn reaches the delay clause too. Had fiscal 2024 rates carried the delay test, ten jurisdictions would have met it; at fiscal 2025 — the first year the test binds — seven do. Florida, Massachusetts, Maryland, New Jersey, and New York left that hypothetical roster and Delaware and Illinois joined it: the assignment that zeroes a state’s FY2028 bill churns under the same measurement noise that moves tiers.
The fiscal 2025 publication also started the clock the statute set: the FY2028 share keys to each state’s fiscal 2025 or fiscal 2026 rate, at its election, and fiscal 2026 closes September 30, 2026. The deployed simulator now prices that election — for Colorado, a 52.5% probability that a QC-sized fiscal 2026 measurement lands below the locked 10.09% rate, worth about $31M a year in expectation from the election alone; the dollars come from the near-even odds the measurement lands below the 10% tier boundary, repricing the $63.4M step — and models the delay clause as it binds: delayed years enter expected bills as zero, and a fiscal 2026 draw that crosses 13.33% pushes the start to FY2030, zeroing FY2029 as well.
The same clock defines what can still be registered. Fiscal 2026 is the first measurement year the statute exposes end to end — it opened after the July 4, 2025 enactment (per the GPO record for Public Law 119-21, as the registration documents) and closes September 30, 2026 — and no official fiscal 2026 rate yet exists. The repository therefore now carries a pre-registration for them: the disclosure above (a check of input independence, not a registered forecast) holds for fiscal 2025, and the fiscal 2026 design closes that gap prospectively. analysis/PREREGISTRATION_OBBBA_BOUNDARY.md commits the boundary quasi-experiment in advance — running-variable windows at the 6/8/10 tier cuts and the 13.33% delay test, estimators and decision rules fixed to seeds, per-state no-response null predictions from this same observed-resample engine, the outcome list (measured rates, the sampling-plan election that carries the precision waiver, cause-mix shifts), and falsification tests, one of which — the fiscal 2024 pre-period placebo — is executed and locked at registration — with the machine-readable predictions SHA-256-pinned and their regeneration byte-locked in CI. The public commit history is the registration record and the registering pull request’s merge is the registration event: whatever fiscal 2026 shows, the analyses this repository will run on it were fixed while the year was still in the field, before its official outcomes exist, and anything beyond them will be labeled post hoc.
Pricing engine adoption through the formula
The decomposition of Section 5 says what share of error dollars the computing apparatus carries; the cost-sharing formula decides what those shares mean in billed dollars. The deployed simulator composes the two: for each jurisdiction, zero the error dollars of every case whose recorded cause slots include a computing-apparatus code, shift the anchor down by the file-rate reduction those removals produce, and reprice the fiscal 2026 election and delay machinery on the adjusted draws. Cause coding exists for all 53 jurisdictions; engine verification covers seven, so in the other 46 the scenario prices the file’s own coding, not a verified computation. The anchor convention is additive by design: the official rate exceeds the file-computable rate by a layer of federal re-review integration and ineligible-case error this simulator treats as a fixed level everywhere (Section 9), and the cause coding says nothing about that layer’s composition — so the removed dollars lower the anchor by exactly the percentage points they remove from the file rate, never scaled onto the adjustment. The fiscal 2025 rate stays locked history — adoption enters only through the simulated fiscal 2026 measurement, which is the counterfactual’s shape: a state adopting now changes the year being measured, not the year already published. The per-case class flags are committed with the artifact and reconcile exactly (at \(10^{-9}\), on the unrounded weight path) with the cause-share values behind Table 3, with the serialization difference of the published rounded arrays bounded at \(2 \times 10^{-6}\) and the case ordering locked to those arrays by test; an independent Python mirror of the browser engine, down to its random-number stream, reproduces every figure quoted below. The strict and broad classes are two accounting scenarios under nested cause-code sets, not bounds: because billing is not monotone in error reduction, an intermediate convention need not land between them. Neither is a causal adoption estimate — cause codes are reviewer judgments, the broad class includes policy misapplication an engine removes only where it drives the determination end to end, and the fiscal 2024 cause mix is assumed for fiscal 2026.
Summed over all 53 jurisdictions, expected FY2028 bills move from $7.67B a year to $7.57B under the strict scenario and $6.94B under the broad one. The strict class carries $232M a year in error dollars (Table 3) but moves expected bills by only about $97M: the schedule prices tiers, not points, and a rate reduction that crosses no boundary bills identically. Colorado, measured 0.09 points above the 10% boundary, is the opposite case — the strict removals move its simulated center to 9.54% and the broad ones to 9.30%, reducing its expected FY2028 bill by $16M to $23M a year from a $159M baseline, with the election-win probability rising from 52% to 74–82%.
The formula does not price error reduction monotonically, and the delay clause is why. New York, at 13.18%, sits just under the 13.33% threshold: at baseline, 42% of simulated fiscal 2026 measurements cross it and defer the first bill, holding the expected FY2028 bill to $630M against a $1.08B locked tier value. The broad scenario moves New York’s center to 11.81% — still the 15% tier — and cuts the deferral odds to 5%: the expected FY2028 bill rises to $1.02B. Georgia, at 15.21%, shows the same mechanics from above the threshold: 98% of baseline draws defer again (expected FY2029 bill $9M), while the bounds cut deferral to 86% and 15% and raise the expected FY2029 bill to $63M and $396M. Within the simulator’s FY2028–29 horizon a deferred bill prices as zero, because it keys to fiscal 2027, a year the simulation does not draw — deferral is not forgiveness, and the horizon accounting is disclosed rather than netted. New York’s strict share is exactly zero — its file codes no strict-class dollars — so its strict scenario equals its baseline. The construct differs in kind from the retired accounting levers of Section 8: those subtracted finding-category dollars to stand in for a policy option’s behavioral effect, and a real case showed the substitution reversing the model’s sign; here the subtraction is the question itself — what the file’s own coding assigns to the apparatus a verified engine replaces.
The fiscal 2027 measurement year
Fiscal 2027 is the first measurement year still open to policy and sampling-plan choices — it sets the FY2030 bill, and sampling-plan changes go to the regional office before the review period begins. It is also the first year the 2025 reconciliation act’s parameter changes bind the QC arithmetic: Public Law 119-21 §10101 moves maximum-allotment indexing to June-to-June CPI-U with amended household-size factors, which projects the 48-state four-person maximum to $1,029 (an estimate until the June 2026 index publishes), and the QC tolerance threshold projects to $59 by the unique floor convention that reproduces every published threshold since fiscal 2022 (hardening when USDA publishes the June 2026 food-plan cost).
The deployed simulator prices that year for the seven verified states by repricing their fiscal 2024 cases under fiscal 2026 and 2027 parameters and forward composition — case weights recalibrated to administrative actuals and forward enrollment margins (all required calibration gates pass; four clipped targets are disclosed in the committed summary) — with the repricing authorized by a self-oracle gate: before any parameter changes, the pipeline must reproduce the file’s own formula benefit exactly, which it does for all 6,081 replayable cases. The repriced rate is then re-anchored at the official fiscal 2025 level, the same discipline the simulator uses everywhere.
What repricing cannot decide is a convention: each case’s recorded deviation must be carried from observed to repriced parameters, and fixed-dollars and proportional-to-benefit are both defensible. The two conventions place each verified state’s anchored fiscal 2027 mechanical rate 1.8 to 3.8 percentage points apart (fiscal 2026: 0.9 to 1.8) — comparable to or wider than a five-point-share tier’s 2-point rate width, so the choice of an accounting convention can move a state’s projected tier by itself. The band, not either endpoint, is the projection this method supports, and neither endpoint is a behavioral forecast: the gap is displayed in the simulator as a range and committed with the per-state values. States without verified encodings get the parameter inputs and no projection: a repriced rate without a verified computation would be an unsupported number, so none is shown.
System replacements in the record: event studies
The accounting scenarios of Section 7.2 price a cause class; whether that class moves when the computing apparatus actually changes is a causal question, and a companion paper answers it as far as the record allows (Ghenis 2026). Three state eligibility-system replacements — Rhode Island’s UHIP (September 2016), Kentucky’s Benefind (February 2016), and Oregon’s ONE expansion (February 2021) — are estimated there against synthetic controls drawn from states with no migration in a public event registry, with permutation inference and decision rules frozen before estimation. Rhode Island earns the frozen rule’s signal: strict computing-apparatus error dollars rise $2.90 per weighted case-month against the synthetic donor (p = 0.023) while the client-caused placebo does not fire, and the rise concentrates in fiscal 2017–19, a pre-named window inside the interval for which the Food and Nutrition Service later billed the state $37.3 million — a descriptive, verdict-inert check. Kentucky and Oregon return no_protocol_defined_signal, Oregon’s a refusal because its placebo fires inside the pandemic window. A second frozen protocol decomposes the Rhode Island result by cause code and finds the rise in computer-generated mass-change error under both a joint-fit and a fixed-donor estimator, with the design’s placebo dependence on the shared donor fit reported beside the result.
The estimand throughout is a bundled system replacement as implemented — staffing, process, and software together — never “the effect of a rules engine.” The connection to Section 7.2 is narrow: the cause class those scenarios price by accounting convention is the class that rose after Rhode Island’s migration. Neither result checks the other. Protocols, artifacts, and both referee rounds are committed (analysis/RIKY_EVENT_STUDY_PROTOCOL.md; analysis/UHIP_DECOMPOSITION_PROTOCOL.md; analysis/FIXED_DONOR_PROTOCOL.md; paper-causal/).
Toward engine-computed counterfactuals
The counterfactual gap has begun to close. For one state and one option — Colorado and the standard medical deduction — the pieces now run end to end, and the run itself produced findings. The first is structural: the certified parity chain never consumes Colorado’s standard-medical-deduction rule, because QC editing bakes the deduction into the stored expense fields and the federal computation path reproduces every case exactly without it — a sharper instance of the Minimodel-canon scope point of Section 4.1. (A separate raw-facts leg, reconstructing inputs rather than supplying the file’s intermediates, agrees on 845 of 856 cases, its eleven divergences diagnosed to missing public TANF facts and one utility-allowance tier conflict; only the supplied-intermediates certified chain is exact.) A simulation-only composition adapter that binds the state rule into the federal path, validated by exact baseline invariance on all 856 cases, reprices the option’s removal only as bounds, because the public file censors 46 medical-expense records at exactly $165: between −$1.46 and $0 per case-month. The second is a sign disagreement: feeding the engine-recomputed intermediates through the error model’s direct crossing classifier, applied as a level shift, implies a cost-share change of −$1.55M to −$2.20M per year for removing the deduction. That figure is a range across the three censoring variants, not a confidence interval; the paired-bootstrap intervals are wider — the point variant’s is [−$4.1M, +$0.3M] — and span zero in two of the three. The accounting-reverse bound for the same flip is +$7.1M, and the robust form of the disagreement survives the intervals: all three exclude it, with a maximum upper bound of +$0.6M. Neither sign is validated — the artifact itself warns that the fitted models implying lower error without the deduction is not evidence that documentation requirements reduce errors. The argument for retiring the accounting levers from the public simulator is accordingly not that the model is right but that the two mechanisms answer different questions — one is an upper-bound identity scaling observed error dollars by finding category, the other a model-implied association of re-adjudication risk with the flipped feature — and their divergence on a real case shows the substitution was never innocuous. The simulator now serves only the model scenario as a policy lever, level-gated and labeled as an association; the engine-adoption scenarios of Section 7.2 are accounting constructs by design, kept because there the computing-apparatus classes are the question rather than a proxy for a behavioral response. What remains open is breadth: engine legs for the remaining options (self-employment is not identified from public data, which records net rather than gross income) and the other verified states, feeding the harness raw facts instead of file-derived intermediates (Section 4.1), and the cost-sharing formula itself as an encodable target: the sampling formulas of 7 C.F.R. § 275.11(b) and the tier schedule of 7 U.S.C. § 2013(a)(2), with its election and delay clauses, can be encoded and tested at their published boundary values, replacing hand-transcribed constants in simulators like this one.
Limitations
The parity result certifies agreement with the edited file’s Minimodel-computed chain from supplied intermediates — not independent derivation from raw facts, and not the reviewer-adjudicated outcome fields (Section 4.1); it is also post-correction on the same case set, pending a fiscal 2025 confirmatory run. The public file excludes ineligible-case and full-overissuance error, truncating the error distribution every file-based estimate inherits. The replay decomposition depends on a reconstruction solver whose filters exclude 22 of 305 error cases, and its residual class is an upper bound in case shares, not dollar shares. The error models predict an adjudicated, thresholded label — a property of the measurement system, with a documented manipulation history (Section 3). Cross-state model transport is imperfect: the model’s raw level underpredicts high-error states, all nine coverage gaps remain one-sided negative after the tail and level-factor fixes — and after the committed location repair, which improves every level but closes only part of the gap — and the deployed simulator accordingly serves the model only for its level-gated standard-medical-deduction scenario, with seven jurisdictions disabled outright; every simulation result in this paper uses the observed-resample engine. That mode resamples i.i.d. from a probability sample whose actual design varies by state, treats the official rate’s federal re-review adjustment as a fixed level with no variance contribution, and holds the error process fixed — no behavioral response of agencies or households to cost sharing, no corrective-feedback channel from audit volume, both live questions the fiscal 2025–27 files will begin to answer under the new incentives. Adoption contrasts are descriptive contrasts of policy bundles; nothing here identifies causal effects of burden policies on error.
Conclusion
A measurement system designed for oversight now sets prices. That makes the QC files three things at once: a case-level verification oracle against the agency’s own computational canon — where the bar can be exact, and holding it exact is what made the residuals informative; the dataset showing that most measured error among eligible cases is information failure rather than calculation failure; and a sampling frame whose noise the new formula converts into near-even-odds tier assignment for boundary states. The modeling bar cannot be exact, and this paper went through six rounds of adversarial review, archived unedited in the repository. The system this points toward is one in which the rules that compute benefits, the requirements they impose on households, and the errors they produce are executable, testable, and priced from the same verified source.
Data and code availability
The repository PolicyEngine/snap-qc-sim contains the analysis pipeline (deterministic; independent clean-clone reruns reproduce all five pipeline artifacts byte-for-byte on the pinned interpreter version, recorded in .python-version and each artifact’s provenance block), the simulator, frozen simulation, decomposition, and certification artifacts under paper/snapshot/ (including the complete per-case replay output, the layer-1 and layer-2 classification outputs, and the reconstruction scripts), the archived adversarial review reports — six rounds — and the round-1 editorial synthesis under paper/reviews/, the fact catalog (paper/FACTS.md), the fiscal 2026 pre-registration (analysis/PREREGISTRATION_OBBBA_BOUNDARY.md, with its hash-pinned predictions artifact and deterministic generator), and this manuscript. The verification harness and per-case suite reports are public in TheAxiomFoundation/axiom-oracles; the encodings in TheAxiomFoundation/rulespec-us; the engine in TheAxiomFoundation/axiom-rules-engine. QC public-use files are available from USDA FNS (U.S. Department of Agriculture, Food and Nutrition Service 2025b), and the training files are tracked in the public Giannella and Molin (2026) repository. Reproduction commands are in the repository README.
Disclosure
The author leads PolicyEngine, which builds the simulator described here, and The Axiom Foundation, which builds the rulespec-us encodings and the axiom-oracles verification harness whose parity this paper reports — the paper is an evaluation of systems its author is responsible for. The mitigations are structural: every parity claim replays against the government’s own recorded values at zero tolerance from committed, hash-pinned artifacts any reader can rerun, and the manuscript’s six rounds of adversarial review are archived unedited in the repository.
Acknowledgments
I thank Eric Giannella and Ben Molin for the open reconstruction and registry code this work builds on. All errors are my own.
References
Footnotes
7 U.S.C. § 2013(a)(2)(B)(iii). The test applies mechanically to each year’s rate and is independent of the state’s election. The fiscal 2025 rates published in June 2026 settle the first leg: seven jurisdictions — Alaska (23.15%), the District of Columbia, Delaware, Georgia, Illinois, New Mexico, and Oregon — crossed on fiscal 2025 and owe nothing in FY2028, with no bill before FY2029 — keyed to the fiscal 2026 rate unless that rate also crosses, which pushes the start to FY2030 and is nearly certain for Alaska. Fiscal 2024 rates would have qualified ten, including New York (14.09%); New York’s fiscal 2025 rate of 13.18% misses the 13.33% threshold, so its delay now rides on the fiscal 2026 measurement. Any projection of FY2028 outlays must model the delay, and the simulator does: delayed years enter expected bills as zero.↩︎
The published thresholds — $48, $54, $56, $57, $58 for fiscal 2022–26 — are uniquely reproduced by flooring the indexed value, which puts the fiscal 2027 threshold at an estimated $59: $59.58 unrounded on the May 2026 Thrifty Food Plan cost of $1,018.20, with $60 requiring a June figure of at least $1,025.40. The estimate hardens when the June figure publishes.↩︎